Big data is being increasingly applied to improve patient experience and outcome globally. Patient experience and outcome have been largely neglected so far mainly because hospitals believed that it needed to connect unemotionally and objectively with its patients and treat ailments. But the hospitals are realizing that patient treatment goes beyond physical ailments. It is about how the patient emotionally feels about several things such as behavior, facial expression, approachability, cleanliness, billing experience and empathy experienced in the hospital. Such factors constitute patient experience and hospitals are trying to quantify patient experience in the form of big data. Several use cases testify to the effectiveness of big data in improving patient experience and outcome.
What does patient experience and outcome mean?
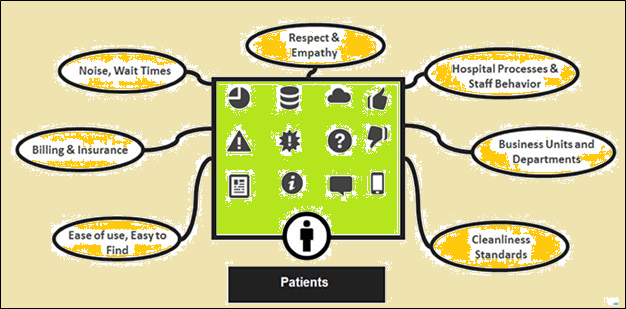
A patient’s experience with a hospital is not only connected to the quality of pure medical treatment but also with the overall emotional experience that includes, but may not be limited to ease of appointments, approachability and friendliness of staff, timeliness, empathy and cleanliness. Patients can award scores based on his or her overall emotional experience with the hospital. Big data technology is able to capture the emotional experience in the form of data. The image below shows that the broad range of emotions and experiences a patient can have is captured in the form of data in various mediums such as social media sites.
Patient experience
The data about patient experience can be sourced from different sources, as shown in the image below.

Data source
Given below are five powerful ways big data is being used to improve the patient experience and outcome.
The Cleveland Clinic way
The Cleveland Clinic significantly improved its patient experience with the help of analytics. Back in 2009, the clinic had not been receiving high scores on patient satisfaction index. Needless to state, that had a lot of implications. So, the CEO Dr. Cosgrove decided to dramatically improve patient services by relying on analytics. To turn the vision into reality, the clinic hired Dr. James Merlino as the Chief Experience Officer. Dr. Merlino hired a third-party agency to conduct a quantitative and qualitative study on what the patients expected from the clinic. The findings from the analytics were different from what the clinic thought the patients expected from the clinic. The patients, the analytics revealed, expected respect, clear and consistent communication and happy hospital staff. These expectations were connected with the emotional state of the patients. Patients wanted display of concern and empathy from hospital staff. It is significant that the study by the outside firm could quantitatively capture patients’ feelings and deliver them as analytics.
Gaining insights from big data
Gaining insights is the first important step towards improving patient experience and there are a lot of ways to do that. First of all, data needs to be accessed from the different sources, as shown in the images above. After that, the data can be analyzed to find out patient feelings towards hospitals. For example, social media and website discussions could reveal that patients tend to feel a lot of anger at the billing inefficiencies of a particular hospital. Advanced analytics could quantify these ranges of emotions. Analytics engines could search websites such as Twitter to find out trending topics on healthcare and analyze the content. It is important to identify the most important issues in the minds of the patients — it could be availability of parking spaces, lack of clarity in communication, unclean bathrooms and even chaotic billing counters.
Identify trending or hot topics
The idea is to identify the trending topics and assign ratings to them to signify the seriousness or importance. For example, positive feedback could be awarded green colors and negative feedback could be given red colors. Advanced analytics is capable of generating reliable ratings from such feedback. Such feedback could also provide valuable materials for the hospitals to create Key Performance Indicators (KPI). The advantage with this approach of gathering and analyzing data is that it happens relatively quickly, when compared to the traditional method of surveys.
Creating action plans and goals
After identifying the trending or hot topics, the next step is to identify a set of variables that are playing a role in patient dissatisfaction. Variables are a set of parameters with assigned values that obviously, change over time. In this context, examples of variables could be billing errors, waiting time at the investigation departments, lack of process, poor attitudes towards patients and difficulty in taking appointments. After the variables are identified, the hospital can decide on what constitutes an acceptable change in variable values. For example, the hospital could target to limit billing errors to 1% of the total number of bills generated in a month. Data science is also capable of reasonably estimating the impact of the change in variable values on patient experience.
Reducing readmissions
According to Paul Muller, Chief Software Evangelist at HP, hospital admissions in the United States constitute about 30% of the total annual healthcare cost and 20% of all hospital admissions happen within 30 days of discharge. Muller observed, “In other words, we’re potentially letting people go without having completely resolved their issues. Better utilizing big-data technology can have a very real impact, for example, on the healthcare outcomes of your loved ones.” Obviously, reducing hospital readmissions could significantly improve patient outcome. But how could big data potentially help reduce readmissions? The key lies in accessing and analyzing medical and health data of the patients and developing plans accordingly. If a patient is readmitted within 30 days, something has most probably gone wrong with the post-discharge care. So, accurate analysis needs to be done on the possible risks, actions, emergency situations, medications, history of illnesses and so on.
Reducing avoidable expenses
According to Muller, medical errors are one of the biggest contributors to the avoidable medical expenses in the United States which could be as high as 17.6% of the GDP. Medical errors such as a sponge left in the stomach after operation or an overdose leading to infection could drive up the cost hospitals incur and the insurance expenses. Inefficiencies in the process also indirectly contribute to higher costs. This goes without saying that inefficiencies and errors can contribute substantially to patient dissatisfaction and reduce patient outcome scores. Big data analytics, combined with the right technology, can expose the problems in an objective manner. Deaths due to errors and negligence can drive patients away from a hospital. Right analysis can control the churn.
Summary
Patient experience and outcome have been neglected components of treatment for a long time and it is finally getting the attention it deserves. Big data most probably is the best way to address the issue. However, hospitals also need to consider the perspective of too much reliance on data. Statistics, at its best, can tell only a part of the story. The challenge is to getting its act together, by putting the action plan generated from the data in practice. There is another perspective also: can the investment in big data analytics also drive up hospital bills? That can be another area of patient experience. It will be interesting to see how hospitals play the balancing act.